Clustering Fragment Screening Hits With a Self-Organizing Map
Clustering Fragment Screening Hits With a Self-Organizing Map (SOM)
1. Download the structures from the PDB
The supporting information for the paper has a list of the PDB ids for the structures. In addition, I was able to obtain an Excel spreadsheet (in the GitHub repo) with the SMILES for all of the ligands from Jaime Fraser and Galen Correy at UCSF. Prody made it easy to programmatically download a lot of structures.
2. Align the structures
To facilitate the comparison, I needed to align all of the structures to a common reference. After speaking with Galen Correy and Stefan Gabhauer from UCSF, I chose 5RS7 as a reference structure and aligned the remaining structures to it. There's actually a bit more to this. Many of the structures have multiple copies of the protein. I did a few tricks with Prody to separate the chains before aligning. Please note that this notebook exploits a feature that isn't in Prody versions before 2.0. If you're running this on your own machine, please do "pip install -U prody" before trying to run the notebook.
3. Assign bond orders to the ligands
It astounds me that the PDB has been in existence for more than 50 years and we still don't have a reasonable means of representing bond orders in ligands. I've ranted about this before, so I won't do it again. Anyway, I used a method similar to the one described in this blog post, which exploits the AllChem.AssignBondOrdersFromTemplate method in the RDKit.
4. Identify structures where multiple ligands are bound
In a few cases, there are multiple ligands bound in the same structure. To avoid confusing the clustering algorithm, I decided to separate these into individual ligands. This is pretty easy to do using Chem.GetMolFrags from the RDKit.
5. Calculate the center of each ligand
There are a number of ways to do the clustering. I opted for something simple and represented each molecule as its centroid.
6. Cluster the fragment structures
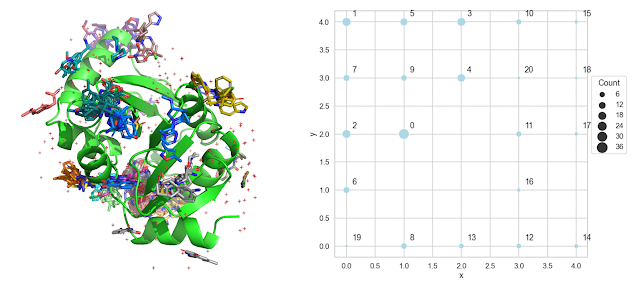
Readers of this blog probably know about my fondness for Self-Organizing Maps (SOMs), which I wrote about here and here. For this application, I like the fact that the SOM not only clusters the data but also provides a "map" indicating which clusters are adjacent. I described each molecule with the x,y,z coordinates of its centroid and clustered. The output of the SOM is shown on the right in the figure above. It's pretty easy to see from this figure that cluster 0 is the largest cluster and that clusters 2,4,6,7 and 9 are adjacent to cluster 0.
7. (Extra) Clustering with HDBSCAN
As I was doing this work, I came across a post on clustering geographic data using Hierarchical Density-based Spatial Clustering of Applications with Noise. The data we're dealing with here consists of coordinates representing the centers of molecules so it's sort of like geographic data. Anyway, I thought I'd give it a try. One of the nice things about HDBSCAN is that it doesn't try to put all of the molecules into clusters. Singletons and outliers are labeled as cluster -1. This part of the notebook isn't very well developed, but I thought I'd put it out there for people to play with. I'll revisit HDBSCAN in a future post.
Resources
The code on GitHub is here
The code on Google Colab is here
Acknowledgments
I'd like to thank Stefan Gahbauer, Brian Shoichet, Jaime Fraser, and Galen Correy for their help with the data. Also, big thanks to James Krieger and She Zhang for help with Prody.


Comments
Post a Comment