Posts

Showing posts from March, 2019

Multiple Comparisons, Non-Parametric Statistics, and Post-Hoc Tests

Image
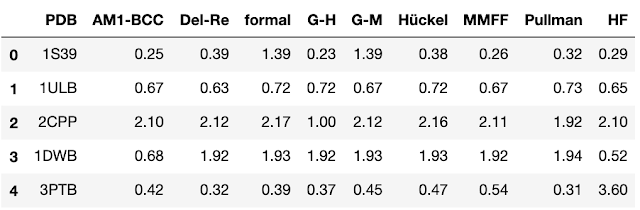
In Cheminformatics, we frequently run into situations where we want to compare more than two datasets.  When comparing multiple datasets, we have a higher probability of chance correlation so we must make a few adjustments to the ways in which we compare our data.  In this post, we will examine the impact of multiple comparisons and talk about methods known as post-hoc tests that can be used to correct p-values when multiple comparisons are performed.  We will also make a brief foray into non-parametric statistics, a technique that is appropriate for dealing with the skewed data distributions that we often encounter in drug discovery.   As usual, all of the data and the code used to perform the analyses in this post is available on GitHub .   I always find it easier to understand a method when I’m presented with an example.  For this case, we’ll look at a 2011 paper from Li and coworkers .   In this paper, the authors compared the impact of nine different charge assignment me

Plotting Distributions

Image
In Cheminformatics, we often deal with distributions.  We may want to look at the distributions of biological activity in one or more datasets.  If we're building predictive models, we may want to look at the distributions of prediction errors.    A recent Twitter thread on "dynamite plots", and the fact that they should be banned from all scientific discourse got me thinking about a few different ways to look at distributions.  I thought it might be useful to put together some code examples showing how one can plot distributions.   As usual, all of the code I used for analysis and plotting can be found on GitHub . Dynamite Plots (don't use these) To demonstrate this concept, we'll look at the dataset published by Lee et al based on an earlier publication by Wang et al , that I used in my last post .  This dataset consists of molecules which had a range of activities against eight different targets.  One way to plot this data is to use the classic dynamite pl