In Cheminformatics, we frequently run into cases where we want to look at leader/follower relationships between chemical structures. For instance, if we've clustered a set of molecules, we might want to start by looking at a table with one example structure for each cluster. We'd then like to be able to select one or more "interesting" clusters and drill down to the cluster members. While this is a frequent workflow, I'm not aware of commercially or freely available tools that do a great job of supporting the exploration of leader/follower relationships with chemical structures. In this post, we'll look at one way of connecting a couple of open source libraries to view cluster representatives and cluster members. As usual, the code and data associated with this post are available on GitHub.
Rather than trying to explain this more fully, let's consider an example. In this example, we'll look at a set of 1,495 drugs from the ChEMBL database. If we cluster the structures using the Butina clustering algorithm, as implemented in the RDKit, we'll end up with each structure in our dataset having a cluster identifier.
We can use the Pandas
groupby function to group the dataframe by cluster and select the first cluster member as an example. If we wanted to, we could get a bit fancier and select the molecule closest to the cluster center as the representative example.
Now that we have our cluster representatives in one dataframe, we can display that dataframe using the nifty
mols2grid component. In the grid below we're showing a single representative for each cluster, with the number of molecules in the cluster shown below the structure. In addition to displaying a grid of structures, mols2grid has checkboxes that allow the user to select structures. These selections can then be accessed using
mols2grid.selection.
Since we can query the mols2grid object to get the selected structure(s), we can use this information to create a new dataframe containing only the selected cluster(s). I've seen a lot of people on Twitter complain about indexing in Pandas. I agree that indexing can be confusing. That's why I tend to use the Pandas
query facility, rather than indexing, whenever possible.
sel = mols2grid.selection.keys()
sel_df = df.query("Cluster in @sel")
Now that we have a dataframe with the selected cluster(s) we can display the molecules from the selected cluster(s) in another table. I wanted to be able to use another mols2grid instance to show the molecules from the selected clusters(s). Unfortunately, that won't work. The mols2grid component maintains global state. If we instantiate a new mols2grid object, we lose the state of the original mols2grid object. It seems like there may be a way around this by modifying the mols2grid code and storing the state in a list or a dictionary. That's a project for another day.
We can't create a second mols2grid instance but we can use the
MolsToGridImage function from the RDKit to show the molecules from the selected cluster.
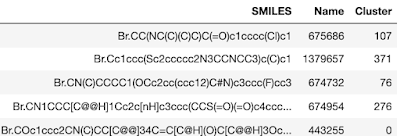
mol_list = [Chem.MolFromSmiles(x) for x in sel_df.SMILES]
legends = list(sel_df.Name.astype(str))
Draw.MolsToGridImage(mol_list,molsPerRow=5,legends=legends,useSVG=True)
One thing I'm really picky about when viewing molecules is having similar structures aligned. I don't like the mental gymnastics required to imagine how structures align. Fortunately, we can use the maximum common subgraph (MCS) implementation in the RDKit to align the structures.
mcs=rdFMCS.FindMCS(mol_list)
mcs_query = Chem.MolFromSmarts(mcs.smartsString)
AllChem.Compute2DCoords(mcs_query)
for m in mol_list:
AllChem.GenerateDepictionMatching2DStructure(m,mcs_query)
Now that we have the pieces in place, we have a two-step workflow for viewing cluster representatives and cluster members.
1. Click on the checkbox in the mols2grid component to select the cluster(s) to view.
2. Shift-return on the cell below the mols2grid component to view the cluster members.
This workflow is ok, but it's not a smooth as I'd like it to be. I'm eager to hear any ideas on how to improve it. I'd also be interested in hearing approaches that others have for examining leader/follower datasets like this.


Comments
Post a Comment