K-means Clustering
In Cheminformatics, we frequently run into situations where we want to select a subset from a larger set of molecules. K-means clustering, a simple, but often overlooked, technique can provide a useful solution. Let's look at a couple of situations where we might need to choose a subset from a larger set of molecules. After that, we'll briefly describe the method and look at how we can apply it using an Open Source implementation that is available on GitHub.
Use Cases
Let's say that a vendor has a set of 2 million compounds available for purchase, but we only have the budget to purchase 50,000. How would we choose the 50,000? The first thing we would probably want to do is to filter the 2 million to remove compounds that contain undesirable functionality or fall outside a desired property range. I wrote an earlier blog post on filtering chemical libraries so I won't spend any time on that here. Let's imagine that we did the filtering and we still have 1.75 million compounds remaining. How do we find a somewhat representative subset of 50,000? There are a number of ways to do this. During the heyday of Combinatorial Chemistry in the 1990s, far too many papers were published on methods for selecting subsets from larger compound libraries.
One relatively simple way to select subsets is to use a clustering method known as k-means clustering. One nice thing about k-means clustering is that it allows (actually requires) the user to specify the number of clusters that will be produced. This is also the biggest downside to the method. K-means doesn't use the overall structure of the dataset to determine the number of clusters. It partitions the data into the number of clusters specified by the user. If the number of clusters is small, we can sometimes end up with molecules that are very different in the same cluster. If the number of clusters is too large, we can end up with redundant clusters. Despite these limitations, k-means provides a reasonable, practical solution to a frequently encountered problem. Ultimately, this is like most of the techniques we use in Cheminformatics. We should never blindly use any method, we need to look at the results (or at least a subset) to ensure that they make sense.
We can run into similar situations when we have biological assays with relatively low throughput. Most pharmaceutical companies have compound libraries with hundreds of thousands or even millions of compounds. Unfortunately, many biological assays are labor intensive or can't be miniaturized to enable large numbers of compounds to be screened. Let's say that our corporate collection has 100,000 compounds, but our assay can only handle 10,000. We could use k-means clustering to select 10% of our screening database as a primary screen. Once we get the results of this primary screen, we could then use similarity searches in the larger database of 100,000 to select compounds for follow-up screens.
Virtual screening provides another interesting use case for k-means clustering. Let's say that we docked a million compounds into the active site of a target of interest. Of these million compounds, 10,000 have reasonable docking scores, but we only have the budget to screen 500 compounds. We could simply choose the 500 compounds with the highest docking scores, but this may not be the best strategy. Published results and lots of experience has shown that the relationship between docking scores and biological activity is somewhat weak. Another strategy might be to cluster the 10K compounds into 500 clusters and select the compound from each cluster with the highest docking score.
Once we've done the clustering in any of the cases described above, we still need to choose one or more molecules from each cluster. In the virtual screening example, the choice is somewhat obvious, we can simply select the molecule from each cluster with the highest docking score. What about selecting compounds for screening? How would we choose which molecule from each cluster to screen? There are a number of ways to approach this and the strategy we choose will be influenced by the ultimate goal of the experiment being performed.
Once we've done the clustering in any of the cases described above, we still need to choose one or more molecules from each cluster. In the virtual screening example, the choice is somewhat obvious, we can simply select the molecule from each cluster with the highest docking score. What about selecting compounds for screening? How would we choose which molecule from each cluster to screen? There are a number of ways to approach this and the strategy we choose will be influenced by the ultimate goal of the experiment being performed.
- Some people choose the molecule that is closest to the cluster center. The thought is that this will increase the diversity of the library and lessen the chance of selecting similar molecules from adjacent clusters.
- If a reliable QSAR model is available, we could choose the molecule from each cluster with the highest predicted activity.
- If we are selecting molecules from an existing screening collection, we could select molecules based on performance in prior assays. We may want to avoid molecules that have been shown to be more promiscuous and active in multiple assays.
- When designing a library for screening one often wants to be able to quickly identify analogs for compounds which were hits in an experimental screen. One way to build a screening library where each molecule has multiple analogs is to select the molecule from each cluster with the largest number of analogs in the larger database.
There is no right or wrong way to cluster a set of molecules or to select representatives from clusters. Ultimately, choices should be influenced by the goals of the experiments being performed. In the implementation described below, I added a field to the output file called "Center" which is set to "Yes" for the molecule closest to the cluster center.
The K-means Clustering Method
As mentioned above, k-means is one of the simplest clustering methods. The method works something like this.
- Assign the number of clusters, we will call this N.
- Randomly select N molecules from the larger set of M molecules. These will be our initial N cluster centers. In many implementations of k-means, the initial selection of N molecules is not exactly random. A number of methods have been developed that try to spread the initial N molecules evenly over the space covered by the larger set of M molecules.
- Determine the distance from each molecule in the larger set of M molecules to each of the N cluster centers. This distance can be calculated in a number of ways, but one of the most common is to calculate the Euclidean distance between the fingerprint for each molecule and the fingerprint for the molecule corresponding to the cluster center. Assign each molecule to the cluster corresponding to the closest cluster center.
- Recalculate the cluster center as the geometric center of the fingerprints for all of the molecules in the cluster. We can do this by summing the individual fingerprint bits and dividing by the number of molecules in the cluster. At this point the cluster center is no longer the fingerprint of any molecule, it is simply a point in the high dimensional space defined by the fingerprints.
- Now that we've redefined the cluster centers, we repeat steps 3 and 4 until either the cluster centers have converged (they stay in roughly the same place) or until we have reached a predefined number of iterations over steps 3 and 4.
K-means clustering has a couple of nice properties, one of which is that we typically don't have to use the whole dataset to identify a set of cluster centers. If we have a large dataset, it can take a while to iterate through steps 2-4 above to identify the cluster centers. One way to "cheat", and speed up the clustering, is to carry out steps 2-4 above with a smaller sample of the larger set of M molecules. In the implementation I wrote, I use 10% of the molecules to identify the cluster centers when the dataset has more than 10,000 molecules. Once the cluster centers have been identified, we can calculate the distance from each molecule in the larger set to each cluster center an assign the molecule to the cluster corresponding to the closest cluster center.
A variant on this idea is a technique called "mini-batch k-means" where subsets are used in each iteration through steps 2-4 above. The code I wrote uses the mini-batch k-means implementation in the SciKit Learn package.
An Open Source K-means Implementation
As mentioned above, I wrote a Python implementation of k-means clustering for molecules that is available on GitHub. The GitHub site has the details on installation and usage so I won't go into that here. In addition to the Python script that does the clustering, I added two Jupyter notebooks that provide examples of how the clustering results can be used. The first notebook shows a situation similar to the virtual screening use case described above. We start with a set of 10,000 molecules and cluster into 100 clusters. We then plot a histogram to look at the cluster populations and use a nice trick in Pandas to select the molecule from each cluster with the lowest LogP.
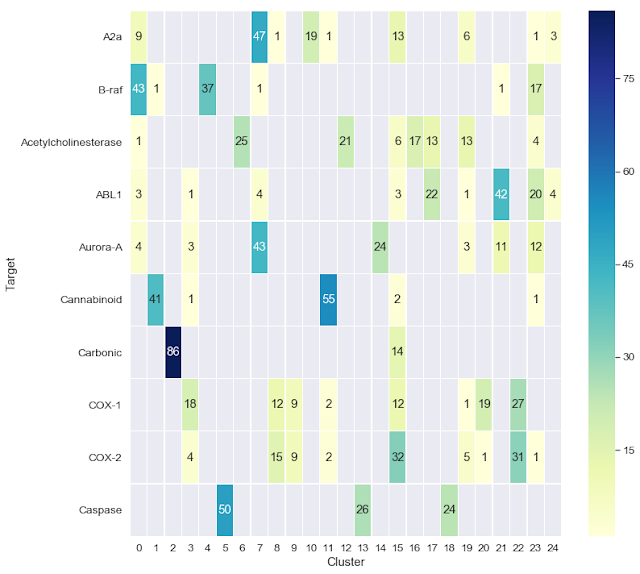
The second Jupyter notebook shows a couple of ways that we can visualize the clustering results. In this case, we begin with a set of 1,000 molecules consisting of 10 sets of 100, each of which is reported to bind to a particular biological target. We cluster this dataset, which was taken from a paper by Cortés-Ciriano and Bender, then use the Jupyter notebook to visualize the clustering results as a heatmap. One cool aspect of this notebook, which was motivated by an earlier blog post from Greg Landrum, is the ability to interactively visualize the chemical structures of the compounds for each target and their cluster assignments.

This k-means clustering implementation is capable of handling relatively large datasets. I was able to cluster 1 million molecules into 10,000 clusters in 1.3 hours on my MacBook Pro. The memory requirements are relatively small, so larger sets should be doable. Hopefully, some of you will find the code useful. Please add a comment or GitHub issue if you have difficulties or improvements to the code.


Comments
Post a Comment